We’re always up for a hefty info-graphic or two, and the folks at flowtown have helpfully knocked out a page-filling monster all about our attitudes to spam.
Billed as, “What are People’s Perceptions of Spam?,” the info-graphic serves up a smorgasbord of spam statistics, including the question, “why did you open spam?”
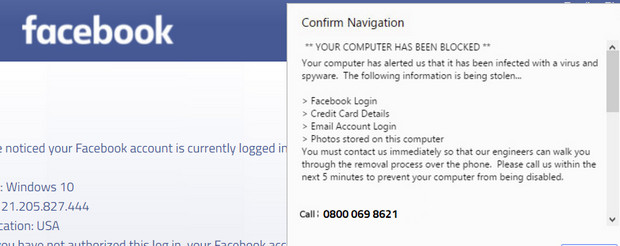
What happens if I click this?
This question revealed that nearly a fifth clicked merrily away, “just to see what would happen,” while the majority hadn’t worked out that it was spam in the first place.
Here’s the full graphic (click on the image to see a bigger version):